Claude Code usage stats
Claude Code usage stats come from the usage record attached to every answer in your local logs. The main numbers are four token types, plus requests, sessions and 5 hour blocks. Cache reads usually dominate: in our measured logs they were 97.7% of all tokens. Drop your .claude/projects folder on this page to see your own stats.
By The Pacewick team (Product and testing). Last updated .
.claude/projects folder hereHow to read your Claude Code usage stats, step by step
- Drop your .claude/projects folder on the dashboard on this page.
- First, look at total tokens, then check how much of it is cache reads.
- Compare input and output tokens, since output costs the most per token.
- Check requests and sessions to see how many answers and chats sit behind the total.
- Open the 5 hour block view to see how your work spreads across blocks.
The dashboard is free and runs in your browser. The first 3 CSV reports each day are free too; see the pricing page for more, or read how we test the tool.
Claude Code usage stats tested with a real input
We ran our made up demo log through this exact dashboard. The numbers come from the same run, so you can compare them with your own logs.
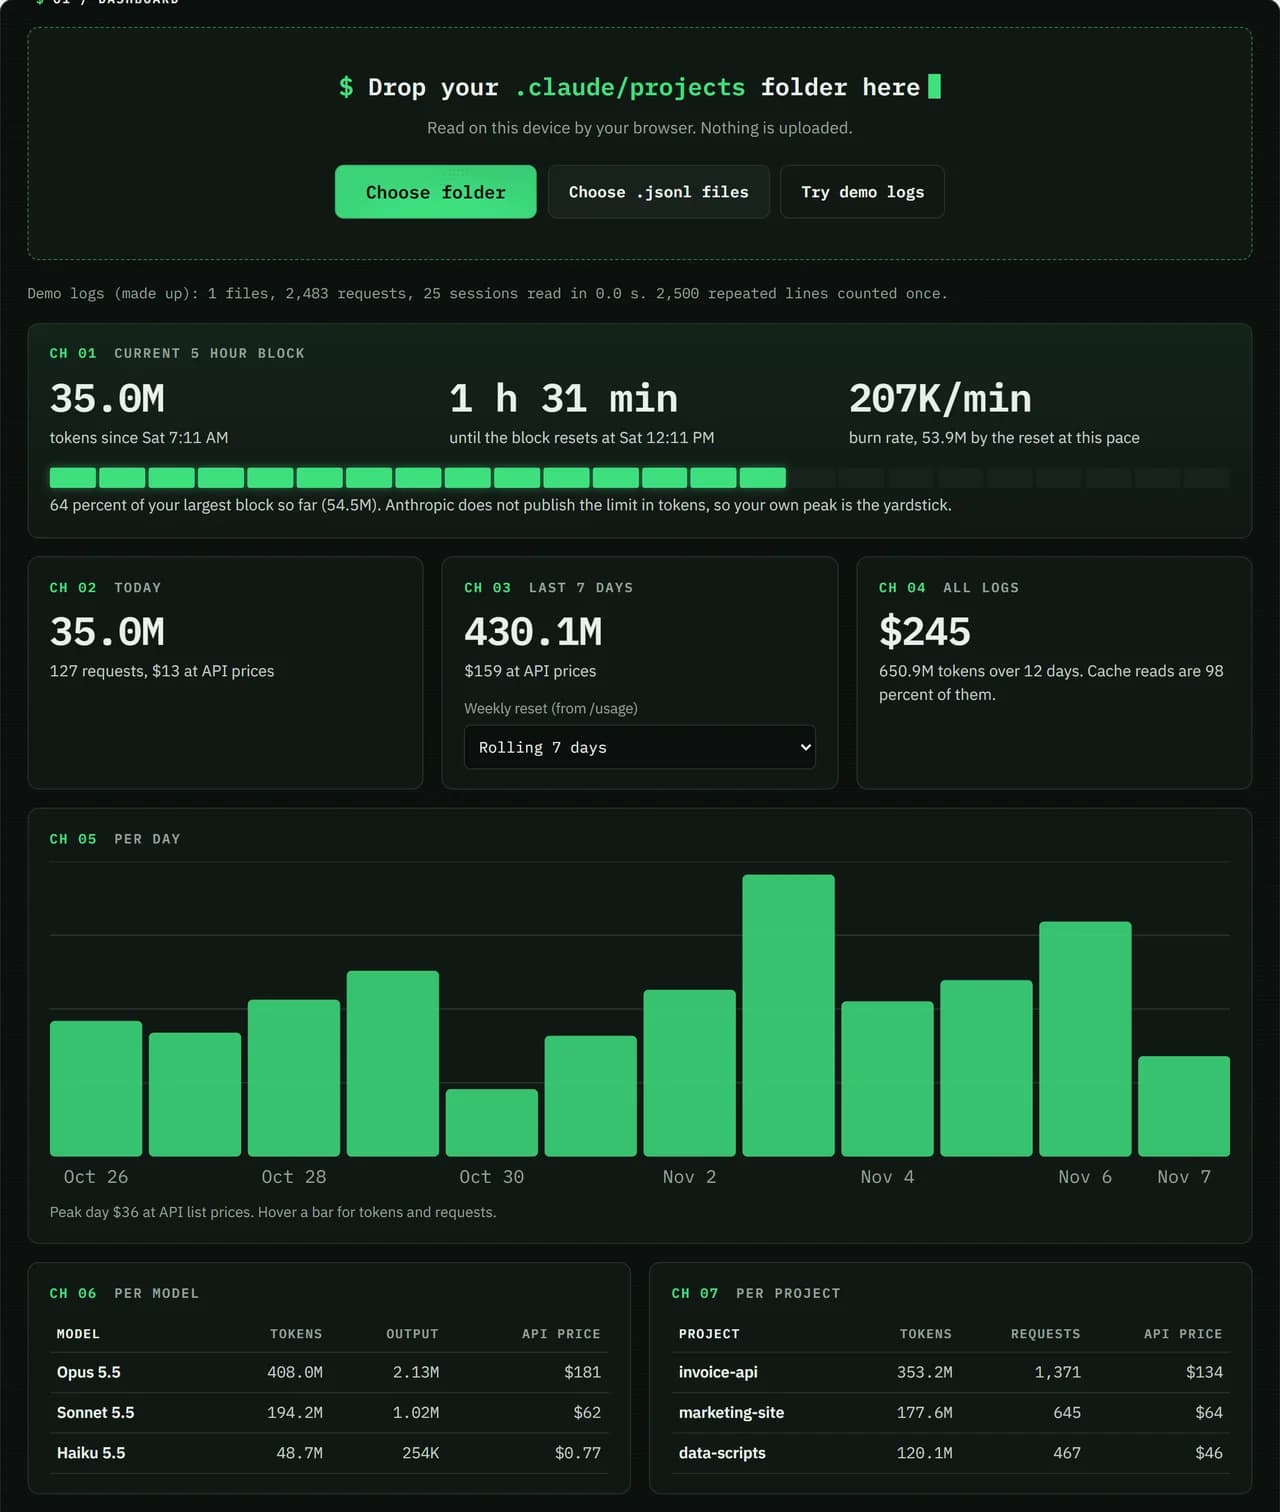
- Test input
- Demo log: 12 days, 3 made up projects, 7,466 lines
- Output
- Dashboard on the demo log
- Requests counted
- 2,483
- Repeated lines skipped
- 2,500
- Total tokens
- 650.9M
- Cache reads
- 97.7 percent
- API list price
- $244.63
- 5 hour blocks
- 24
- Log size
- 3.2 MB
- Parse time
- 35 ms
How we test: every page uses the same demo log, and we check each total by hand. More on the about page.
Four token types in Claude Code usage stats
Every answer from Claude carries a usage record. It lists input tokens, output tokens, cache write tokens and cache read tokens. Also, cache writes are split into 5 minute and 1 hour writes, because they are priced differently.
On the API, a 5 minute cache write costs 1.25x the input rate and a 1 hour write costs 2x. A cache read usually costs about 0.1x. Output is the most expensive type, so a small output count can still move the price a lot.
Why cache reads are 97.7% of the total
Claude Code sends the conversation again with each request, and most of it is served from cache. So the cache read count grows very fast. On one real Windows machine we measured, cache reads were 97.7% of all tokens across 2,675 session files.
That is why a total like 34.9B tokens looks scary at first. In fact, most of those are cheap cache reads. Without the cache, the same work would cost many times more, so a high share is a good sign, not a problem.
Requests, sessions and 5 hour blocks
A request is one answer from Claude. However, Claude Code writes one answer as several log lines with the same usage. The dashboard counts each answer once by its message id and request id. In the logs we measured, that meant 141,824 requests and 156,647 repeated lines skipped.
Next, a session is one JSONL file, usually one chat in one project. A 5 hour block starts with your first message and lasts 5 hours, just like the plan window. For example, the same logs held 1,962 sessions and 334 blocks over 97 days of activity.
What these usage stats leave out
Anthropic does not publish plan limits in tokens. As a result, no token count can tell you your exact plan percentage, and /usage is the only place that shows it. Also, chats on claude.ai and the desktop app count toward your limit but are not in Claude Code logs.
Read the dollar figures as API list prices, since Pro, Max and Ultra are not billed per token. Pacewick is an independent tool, not made by Anthropic.
Measured on one real Windows machine (Pacewick parser)
| Stat | Value |
|---|---|
| Session files read | 2,675 JSONL files, 8.6 GB |
| Requests counted | 141,824 (156,647 repeated lines skipped) |
| Sessions and 5 hour blocks | 1,962 sessions, 334 blocks |
| Active days and models | 97 days, 7 models |
| Cache reads share | 97.7% of all tokens |
Claude Code usage stats FAQ
What are cache read tokens in Claude Code?
They are parts of the conversation Claude reads from cache instead of fresh input. So they usually cost about a tenth of the input rate.
Why are my Claude Code token numbers so high?
Most of the total is usually cache reads. In our measured logs they were 97.7% of all tokens, and they are the cheapest type.
How does the dashboard count requests?
One answer is written as several log lines with the same usage. The dashboard counts it once by message id and request id.
Do Claude Code usage stats show my plan percentage?
No. Anthropic does not publish limits in tokens. Instead, use /usage in Claude Code to see the official plan bars.
Where do Claude Code usage stats come from?
From the JSONL session files in your .claude/projects folder. Your browser reads them locally and uploads nothing.