Claude Code usage dashboard
A Claude Code usage dashboard turns the session logs on your machine into numbers you can act on. Drop the .claude/projects folder below and the page shows tokens and API cost per day, model and project, plus how far you are into the current 5 hour block. The logs never leave your browser.
By The Pacewick team (Product and testing). Last updated .
.claude/projects folder hereHow to open your Claude Code usage dashboard, step by step
- Find the projects folder inside .claude in your home folder (on Windows it is %USERPROFILE%\.claude\projects).
- Drag the whole folder onto the drop zone, or press Choose folder and pick it.
- Wait a few seconds while your browser reads the logs on this device.
- Read the current 5 hour block first, then today, this week and the cost per day.
- Finally, set your weekly reset day and hour from /usage so the week panel matches your plan.
The dashboard is free and runs in your browser. The first 3 CSV reports each day are free too; see the pricing page for more, or read how we test the tool.
Claude Code usage dashboard tested with a real input
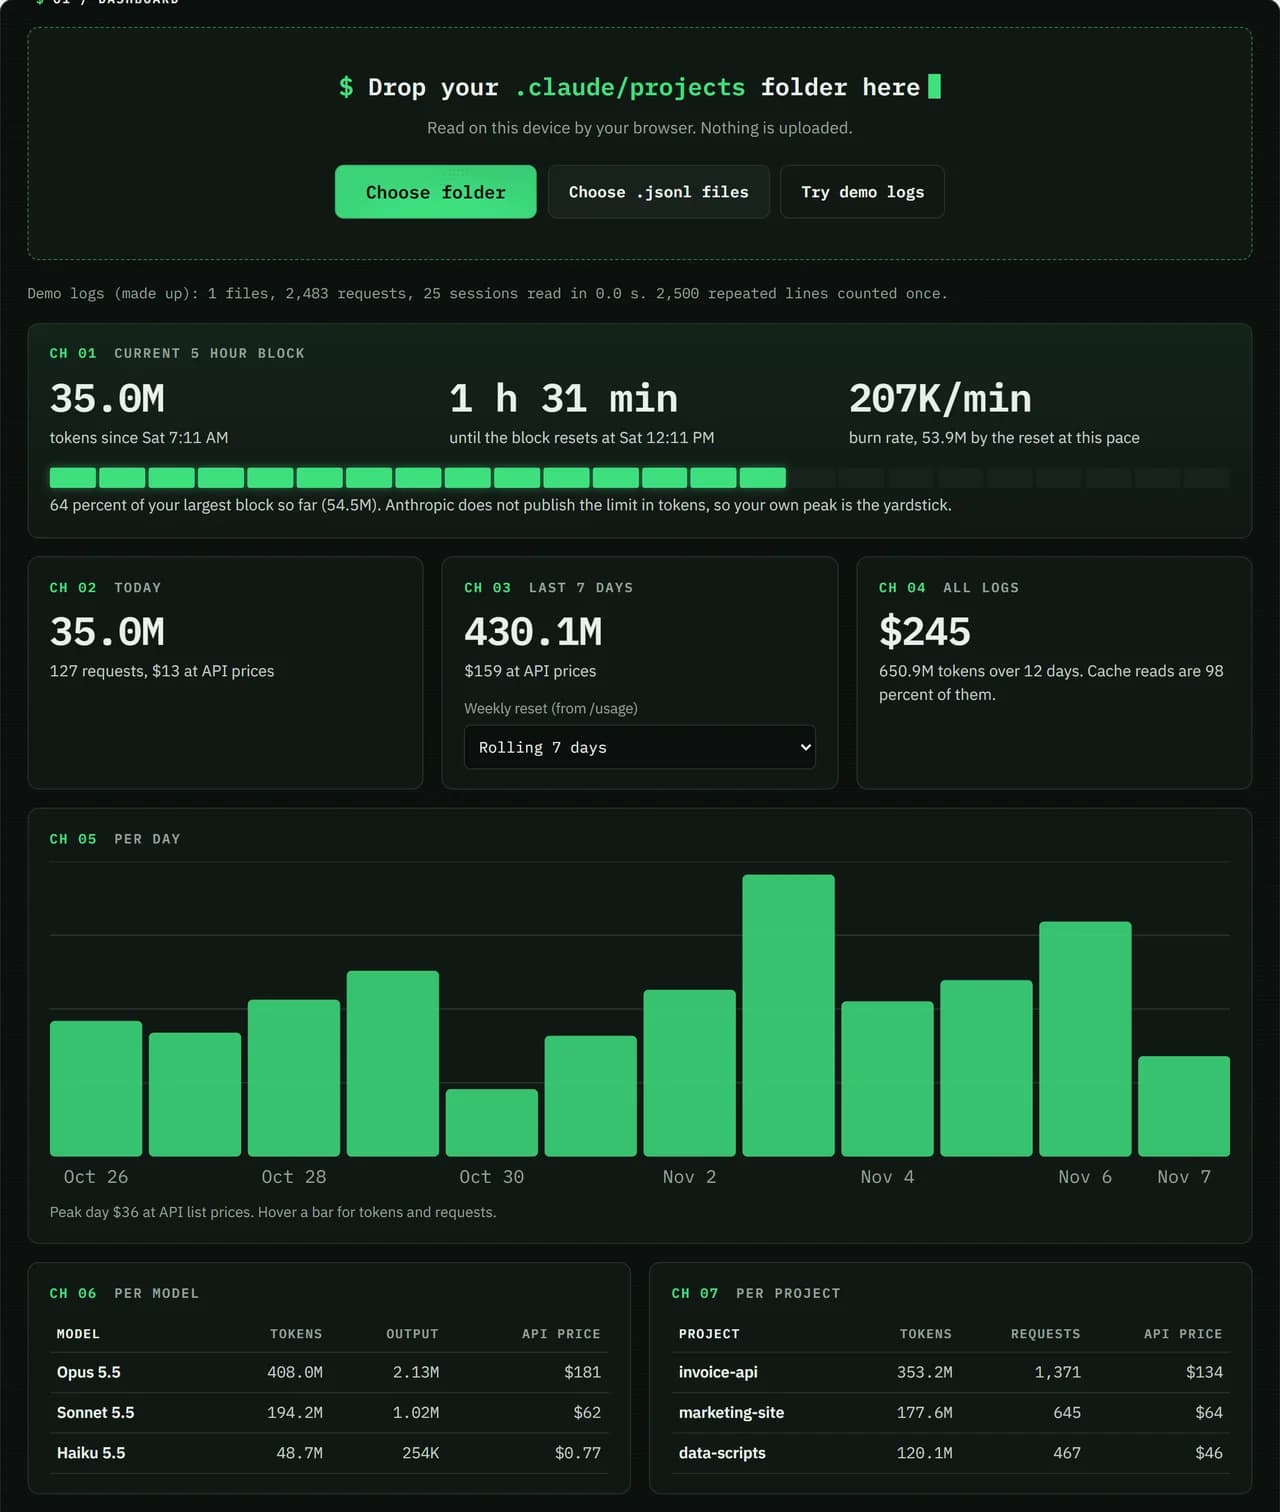
We ran our made up demo log through this exact dashboard. The numbers come from the same run, so you can compare them with your own logs.
- Test input
- Demo log: 12 days, 3 made up projects, 7,466 lines
- Output
- Dashboard on the demo log
- Requests counted
- 2,483
- Repeated lines skipped
- 2,500
- Total tokens
- 650.9M
- Cache reads
- 97.7 percent
- API list price
- $244.63
- 5 hour blocks
- 24
- Log size
- 3.2 MB
- Parse time
- 35 ms
How we test: every page uses the same demo log, and we check each total by hand. More on the about page.
What the Claude Code usage dashboard shows
The top panel is the current 5 hour block. It shows the tokens used since the block opened, the minutes until it resets and your burn rate per minute. A gauge compares the block with the largest block you have ever finished, because Anthropic does not publish the limit in tokens.
Below that you get three quick panels: today, this week and everything in your logs. Then a bar chart shows the API price per day for the last 30 active days. Two tables split the same totals by model and by project, so you can see which repo or which model eats the budget.
Where the numbers come from
Claude Code writes every session to a JSONL file in the projects folder. Each answer from Claude carries a usage record with input, output, cache write and cache read tokens. However, one answer is written as several lines with the same usage, so the dashboard counts each answer once by its message and request id.
Costs use the public API list price of each model, including the higher price of one hour cache writes. On a Pro, Max or Ultra plan you do not pay per token, so read the dollar figure as what the same work would cost on the API. It is still the best single number for comparing days and projects.
Private by design
The files are read by a Web Worker inside your browser tab. Nothing is uploaded, and the page keeps working with the network off once it has loaded. In fact, the only request that ever leaves the page is the optional CSV report, and it carries totals only.
Project names stay hidden in that report unless you tick the box. Prompts, code, file paths and tool output are never part of it, because the dashboard never even parses those lines.
When this dashboard is not the right tool
Your plan limit also counts chats on claude.ai and the desktop app, and those do not appear in Claude Code logs. So if you chat a lot, the official /usage screen in Claude Code is the only exact view of your remaining allowance. Use this page for the history, the trends and the per project split that /usage does not keep.
Also, Claude Code deletes session files older than 30 days by default. If you want a longer history, raise cleanupPeriodDays in your settings first.
What the dashboard reads from each log line
| Field | Used for |
|---|---|
| message.usage.input_tokens | uncached input, priced at the model input rate |
| message.usage.output_tokens | output, the most expensive token type |
| cache_creation (5m and 1h) | cache writes, 1.25x or 2x the input rate |
| cache_read_input_tokens | cache reads, usually 0.1x the input rate |
| timestamp, sessionId, cwd | days, 5 hour blocks, sessions and projects |
Claude Code usage dashboard FAQ
Is the Claude Code usage dashboard free?
Yes. The dashboard itself is free with no account. Three CSV reports a day are free as well, and credits unlock more.
Do you upload my Claude Code logs?
No. Your browser reads the files on your own computer. Only the optional CSV report sends totals to our server, and never prompts or code.
Why does the dashboard not show my plan percentage?
Anthropic keeps the real limit on its servers and does not publish it in tokens. The dashboard compares your current block with your own largest block instead, while /usage shows the official bars.
Does it work on Windows?
Yes. It runs in any modern browser on Windows, macOS and Linux. On Windows the folder is %USERPROFILE%\.claude\projects.