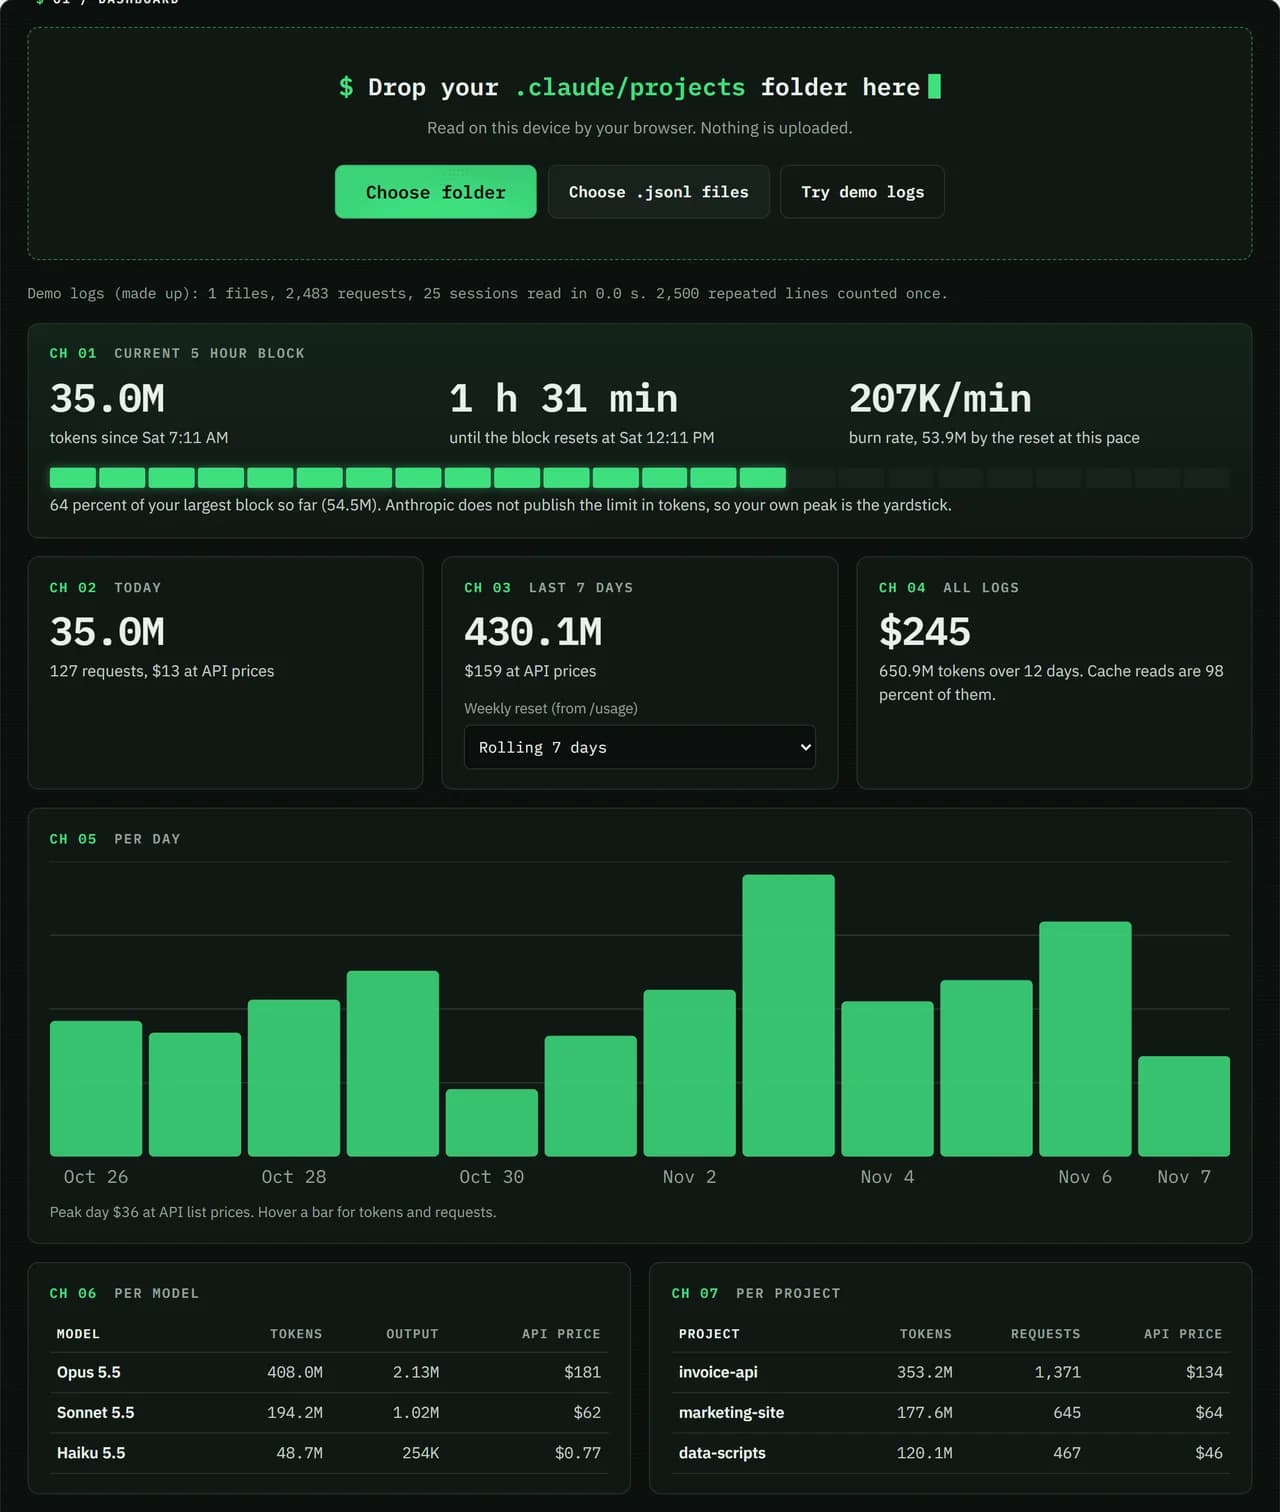
Your Claude Code usage, one panel at a time
These are real panels from our demo log: 12 work days, 3 made up projects and 651 million tokens.

01The open block
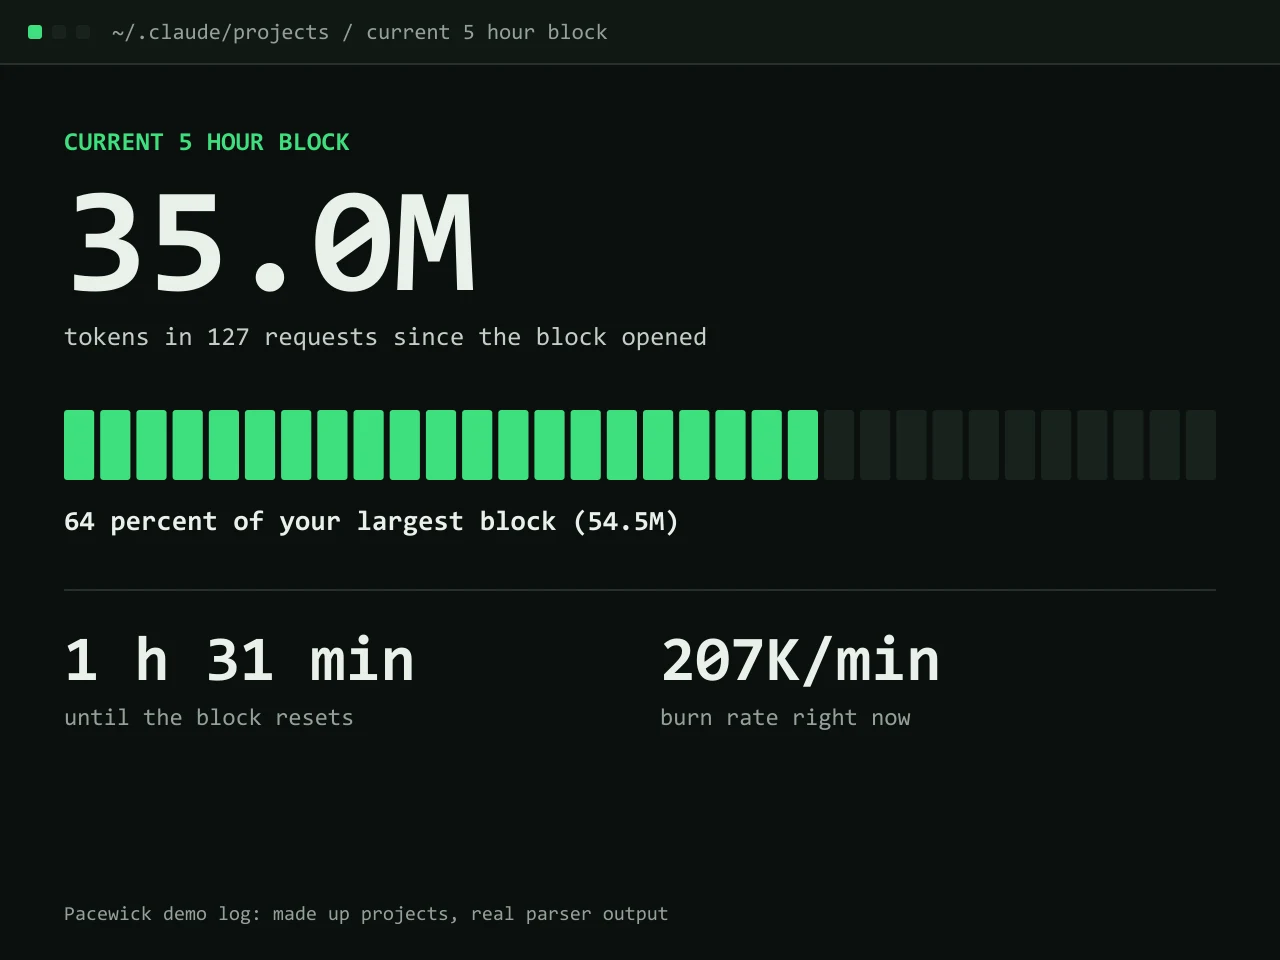
35.0M tokens with 1 h 31 min to go
First, the panel you check most. The open 5 hour block holds 127 requests so far, which is 64 percent of the largest block in the log. The burn rate says where it lands by the reset.
Learn more about 35.0M tokens with 1 h 31 min to go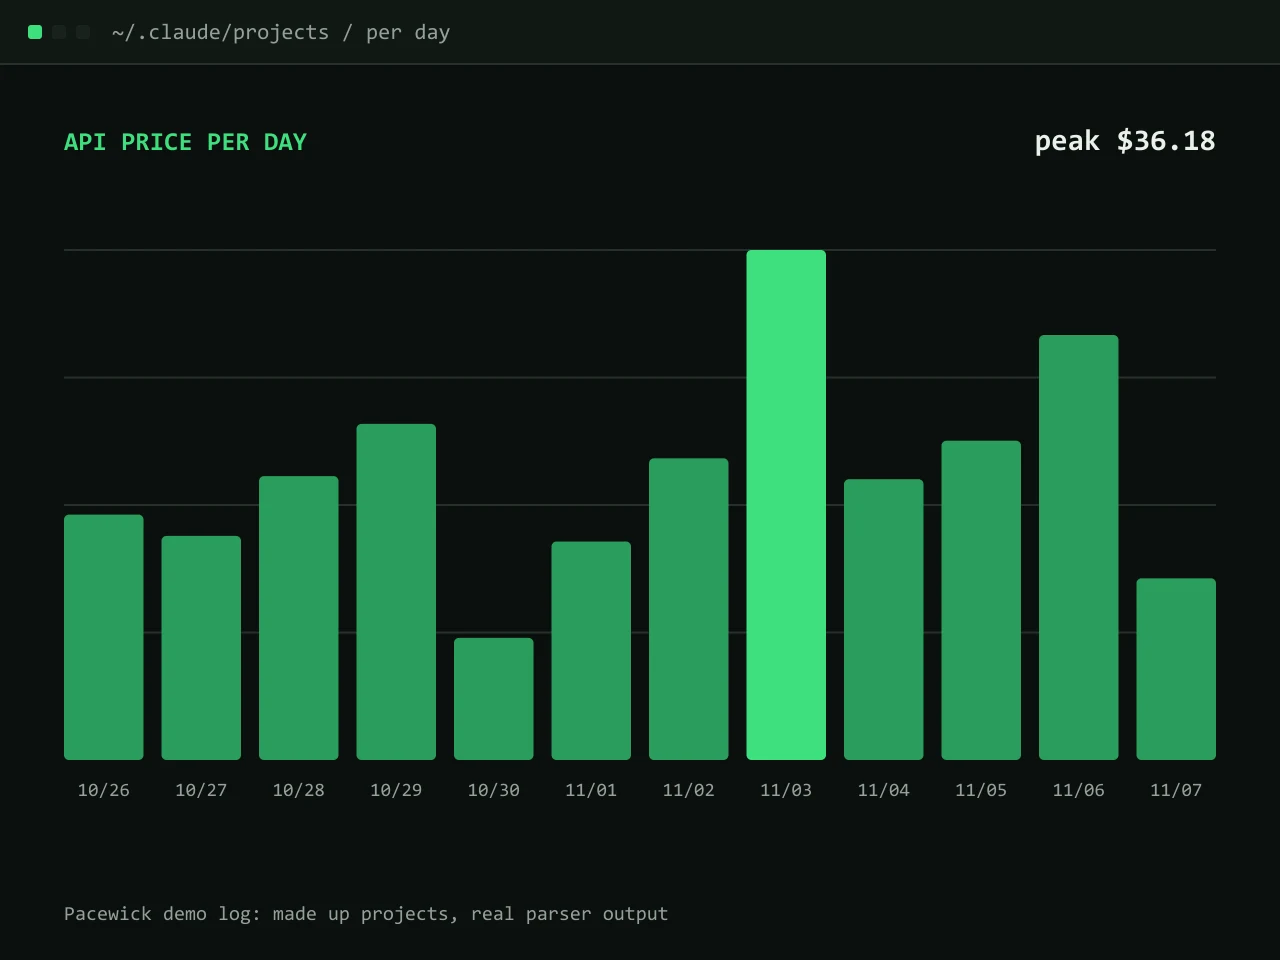

02Per day
Busy days stand out, the peak is $36
Next, the bars show the API price per day. So a heavy refactor day is easy to spot, and you can match it to the work you did.
Learn more about Busy days stand out, the peak is $36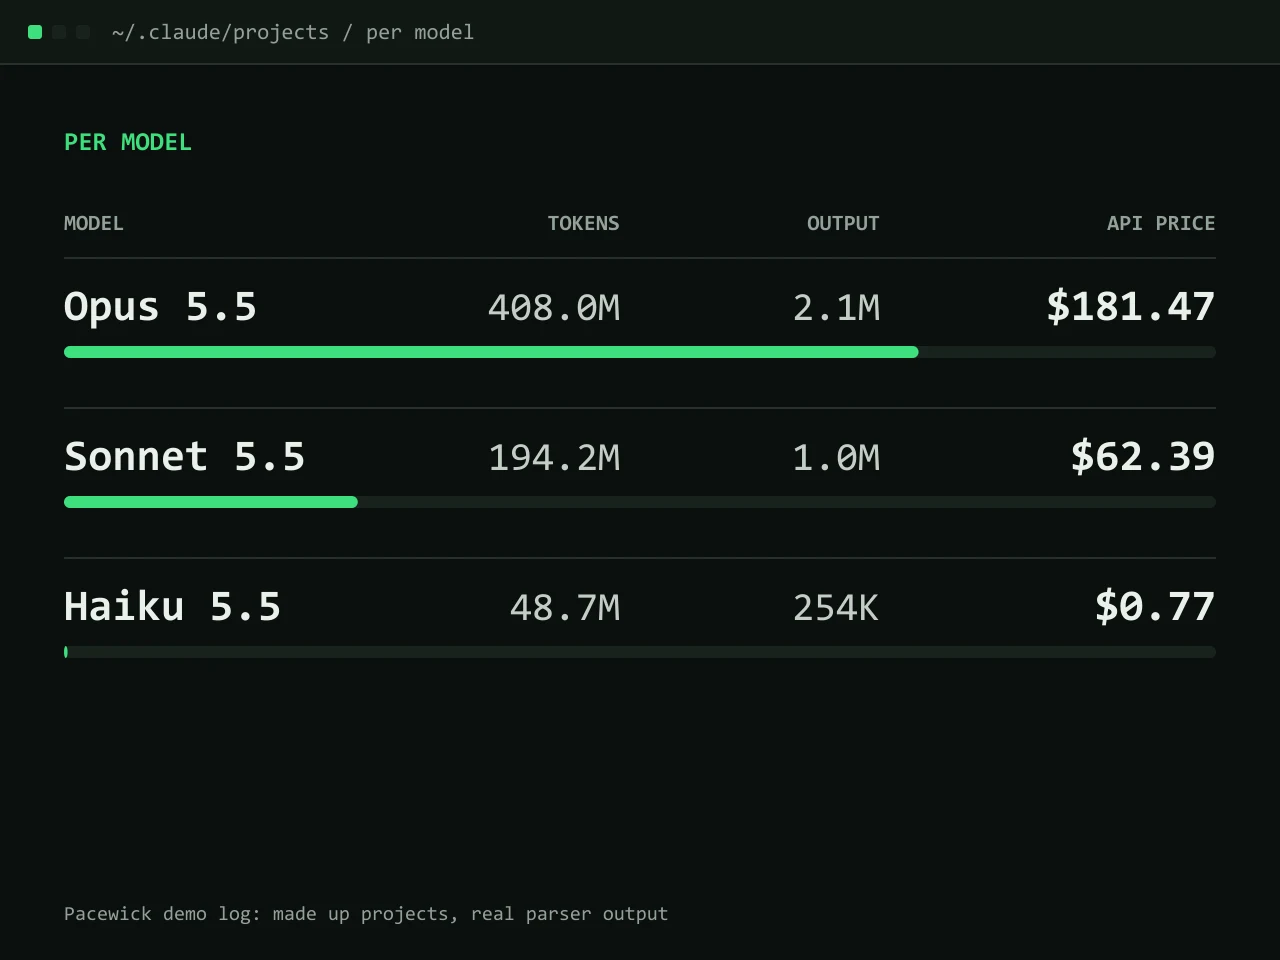

03Per model
Opus 5.5 is 74 percent of the bill
The model table splits tokens, output and price. For example, Haiku 5.5 did 181 requests for under a dollar, while Opus 5.5 carried most of the cost.
Learn more about Opus 5.5 is 74 percent of the bill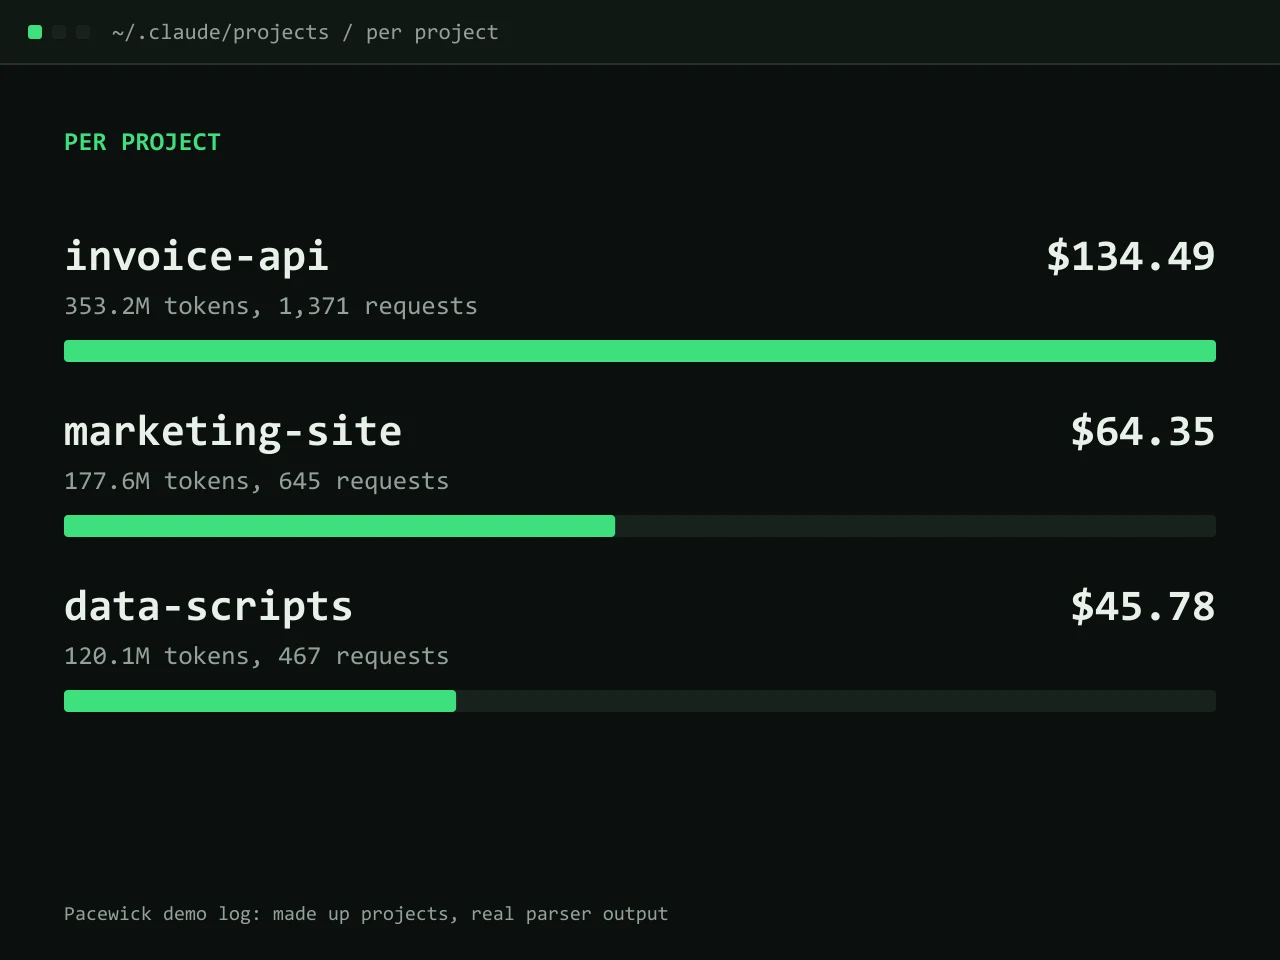

04Per project
Every repo gets its own line
Because each log sits in a folder named after the project, the dashboard can split the totals by repo. That answers the question a client invoice or a team lead will ask.
Learn more about Every repo gets its own line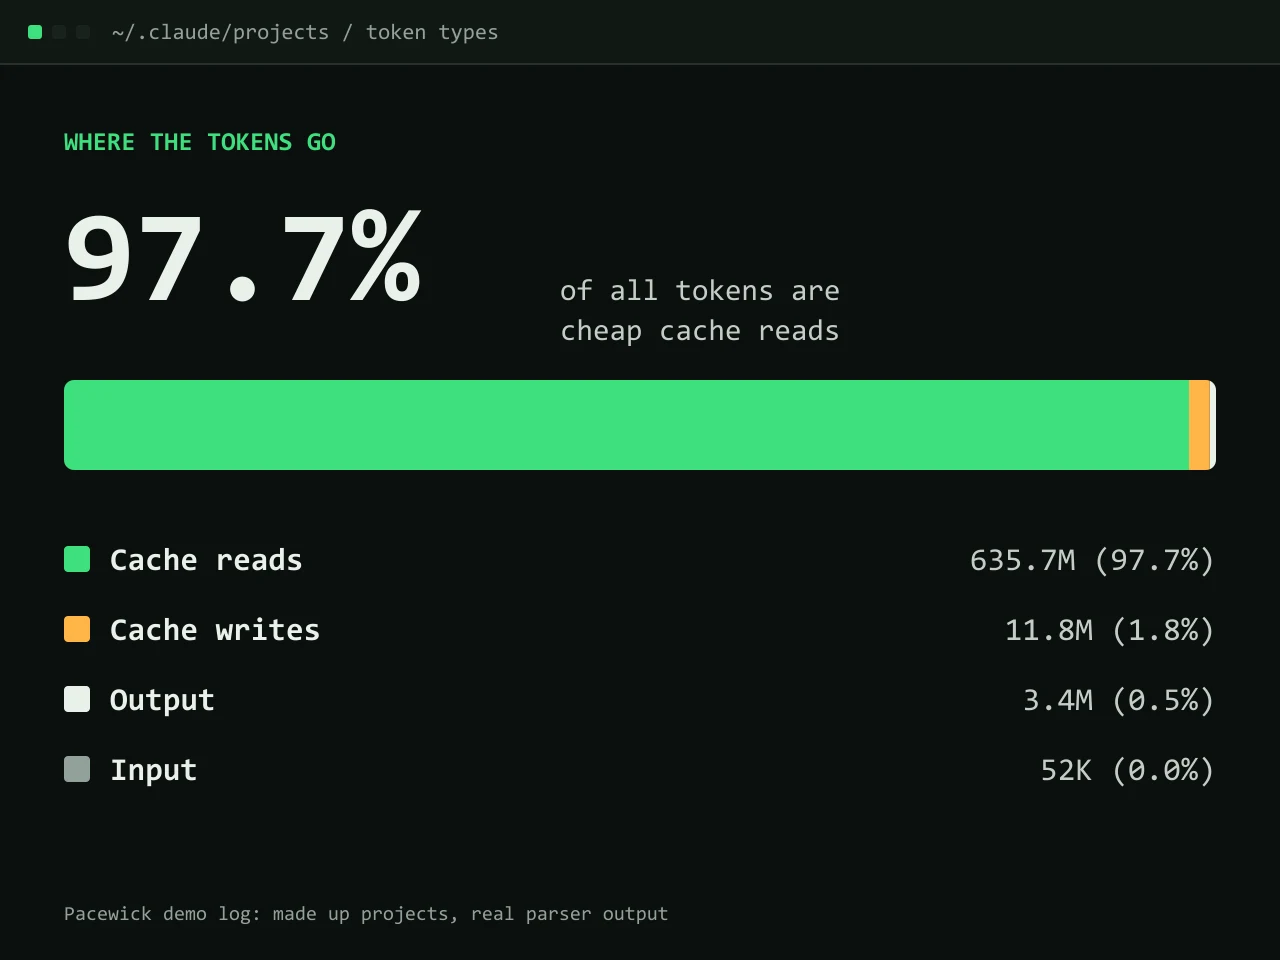

05Token types
97.7 percent are cache reads
In fact, almost every token is a cheap cache read of context Claude already has. That is why a huge token count can still mean a modest API price.
Learn more about 97.7 percent are cache reads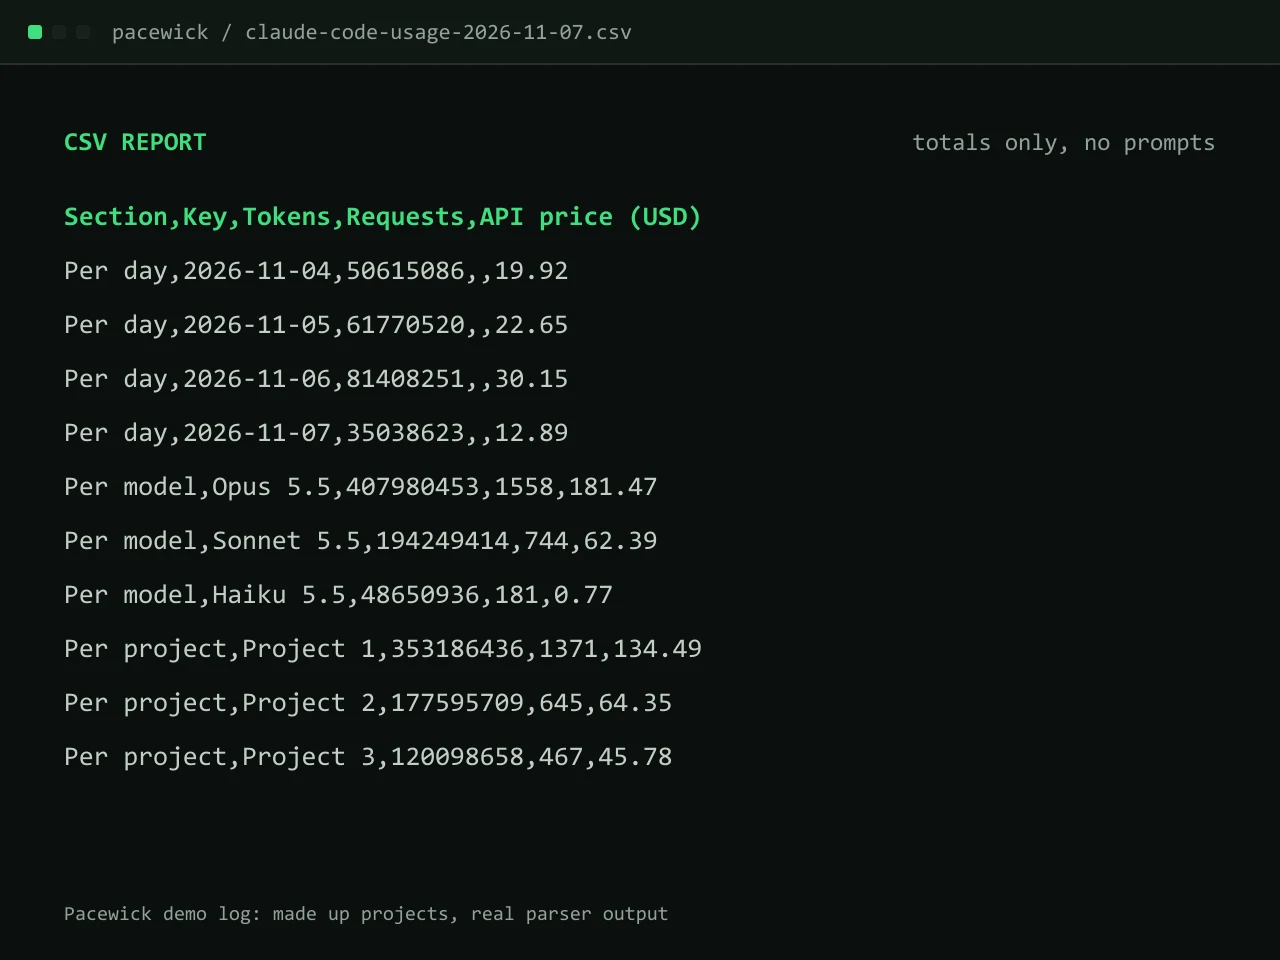

06CSV report
Totals to a spreadsheet, nothing else
Finally, the report turns the same totals into a CSV file. Project names are hidden unless you tick the box, and prompts never leave the page.
Learn more about Totals to a spreadsheet, nothing else
Read your own logs now
First, drop the projects folder on the dashboard. Then compare your week with the demo.