Check Claude Code usage
To check Claude Code usage, type /usage inside Claude Code. It shows the official plan bars and what is eating your limit. For the reset time, open Settings > Usage on claude.ai. Then, for history per day, model and project, drop your .claude/projects folder in the free dashboard on this page.
By The Pacewick team (Product and testing). Last updated .
.claude/projects folder hereHow to check Claude Code usage in under a minute, step by step
- Type /usage in a Claude Code session to see your plan usage bars and activity stats.
- Next, run /status if you only want a quick look at what is left of your plan.
- Open Settings > Usage on claude.ai to see the current session and the time until it resets.
- For history, drop your .claude/projects folder in the dashboard on this page.
- Compare the current 5 hour block in the dashboard with the bars in /usage before a long task.
The dashboard is free and runs in your browser. The first 3 CSV reports each day are free too; see the pricing page for more, or read how we test the tool.
Check Claude Code usage tested with a real input
We ran our made up demo log through this exact dashboard. The numbers come from the same run, so you can compare them with your own logs.
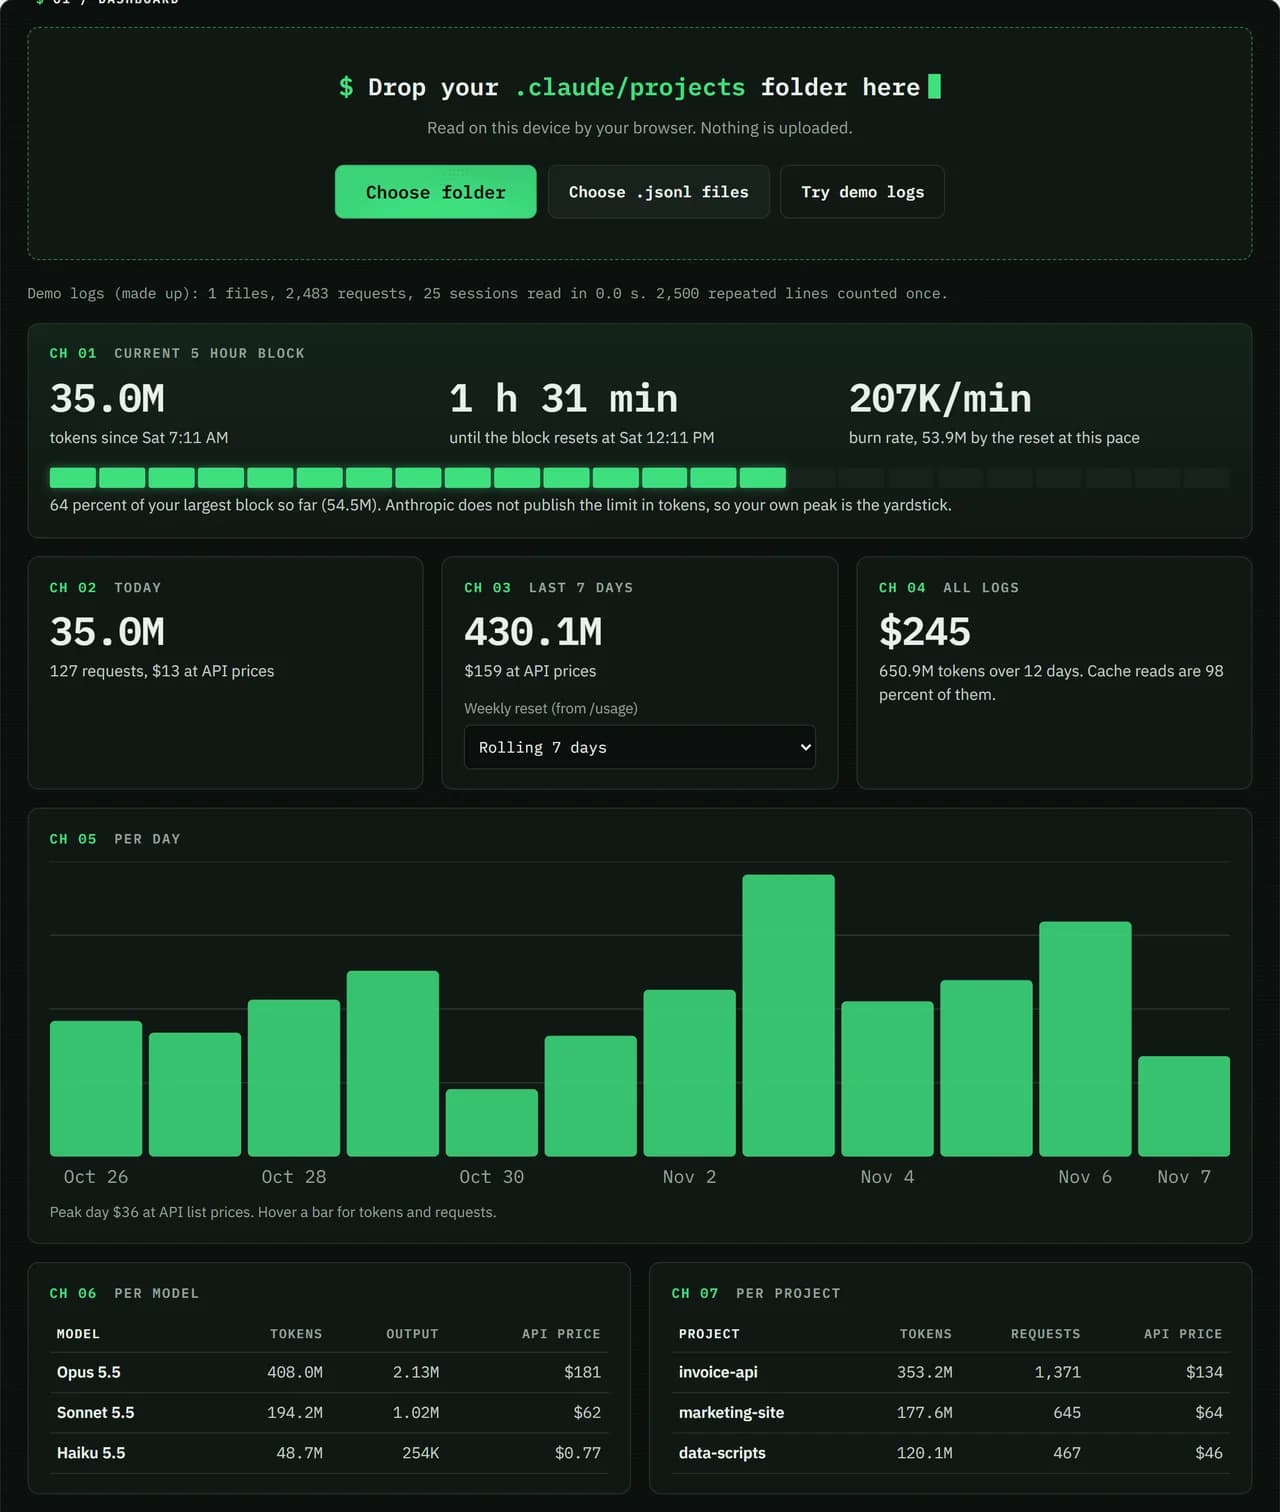
- Test input
- Demo log: 12 days, 3 made up projects, 7,466 lines
- Output
- Dashboard on the demo log
- Requests counted
- 2,483
- Repeated lines skipped
- 2,500
- Total tokens
- 650.9M
- Cache reads
- 97.7 percent
- API list price
- $244.63
- 5 hour blocks
- 24
- Log size
- 3.2 MB
- Parse time
- 35 ms
How we test: every page uses the same demo log, and we check each total by hand. More on the about page.
The fastest way to check Claude Code usage
Start with the /usage command, because it runs right where you work. It shows your plan usage bars, a few activity stats and a breakdown of what uses up your limit, with tips. In fact, it is the only exact view of your plan percentage, since the real limit lives on Anthropic servers.
There is also /status. Anthropic help pages point to it for keeping an eye on what remains of your plan. So if you just want a yes or no before a big refactor, one of these two commands is enough.
When Settings > Usage is the better place
Your plan has two limits: a session limit that resets every 5 hours and a weekly limit. The 5 hour window starts with your first message and resets in full 5 hours later. Settings > Usage on claude.ai shows the current session and how long until it resets.
It also shows when your next weekly reset happens. That reset falls at a fixed day and hour assigned to your account. As a result, it is worth reading once and writing down, because the dashboard on this page can use it for its week panel.
Check usage history with the log dashboard
The built in views answer one question: how much is left right now. However, they do not keep a long history per project or per model. For that, the dashboard reads the JSONL session logs that Claude Code already writes in your home folder.
Drop the folder and you see tokens and API price per day, per model and per project. You also see your current 5 hour block next to your largest finished block. The files are read in your browser, so nothing is uploaded.
What a log based check cannot see
Your limit is shared with claude.ai chats, the desktop app and the mobile app. Those chats are not in Claude Code logs, so the dashboard may show more room than you really have. Also, Anthropic does not publish limits in tokens, so the gauge compares you with your own past blocks.
In short, use /usage for the true number and this page for the story behind it. Pacewick is an independent tool, not made by Anthropic.
Which view answers which question
| Where to look | Best for |
|---|---|
| /usage in Claude Code | official plan bars and what uses your limit |
| /status in Claude Code | a quick look at what remains of your plan |
| Settings > Usage on claude.ai | current session and time until reset |
| This dashboard | history per day, model, project and 5 hour block |
Check Claude Code usage FAQ
How do I check my Claude Code usage limit?
Type /usage in Claude Code. It shows the official plan bars. Settings > Usage on claude.ai shows the same session and when it resets.
Can I check Claude Code usage without a terminal?
Yes. Open Settings > Usage on claude.ai, or drop your .claude/projects folder in the dashboard on this page. Both work from a browser.
Why does /usage show more used than the dashboard?
Your limit also counts claude.ai and desktop chats. Those are not in Claude Code logs, so /usage is the number to trust.
Where does Claude Code keep its usage logs?
In the projects folder inside .claude in your home folder. On Windows that is %USERPROFILE%\.claude\projects.